---
Explanation
The New ABAP Debugger is a new feature of ABAP 7.4 that replaces the classic ABAP Debugger. It offers a range of new features such as a search function and conditional breakpoints, as well as improved performance and usability. It also provides more information about the source code, including syntax highlighting and a source code browser.
The Classic ABAP Debugger is the traditional debugging
tool used in ABAP versions prior to 7.4. It offers basic debugging features
such as breakpoints, variable watches, and a step-by-step execution of
code. It is still available for use in ABAP 7.4 but is not the default
debugger.
What are the primary methods of starting the ABAP Debugger?
The following are the primary methods of starting the Debugger:
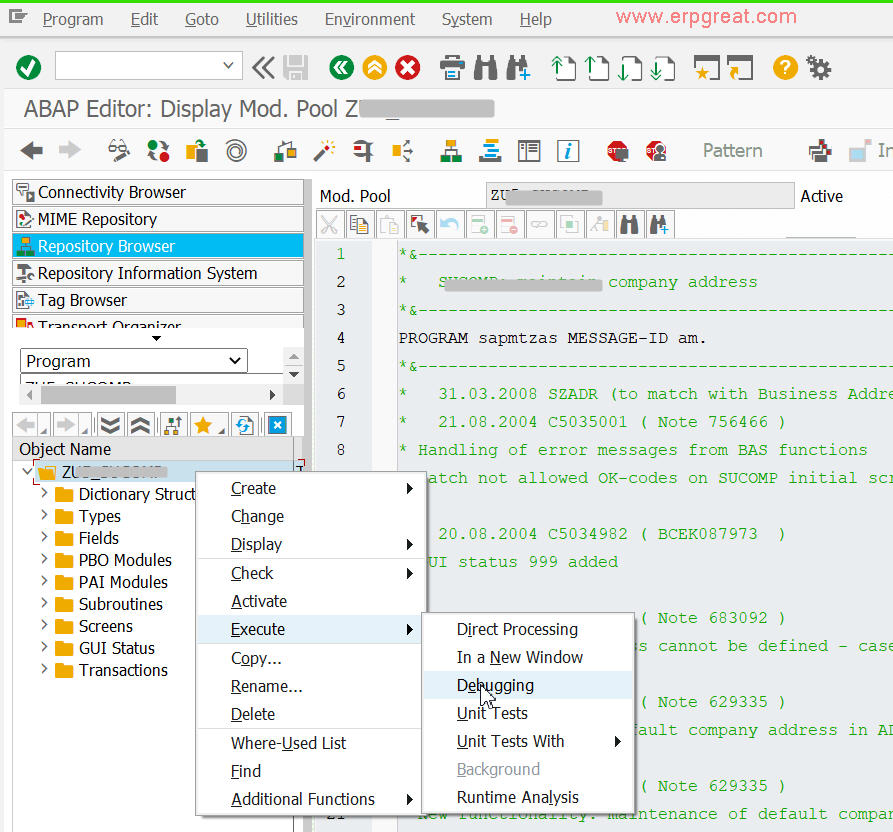
1. In the SE80 navigation area, select the menu path Execute Debugging for the selected program.
2. In the editing area, select the desired program line and select Set/Delete Breakpoint. Then start the program by selecting (Execute) Direct Processing or pressing (F8).
3. Select System -> Utilities -> Debug ABAP or System -> Utilities -> Debug Screen.
4. Enter /h in the command field in the standard toolbar and press (Enter) or use a shortcut to provide the command to the session.
---
Questions:
1) The Debugger displays a maximum of eight data objects at one time.
A. True
B. False
2) Both the classic Debugger and the new Debugger can be used on all ABAP code without restriction.
A. True
B. False
3) Under which circumstances will the classic Debugger
start as the Debugger?
Select all that apply.
A. None; the new Debugger will always start as the Debugger.
B. When five modes already exist for this logon session.
C. When the number of debugging sessions exceeds half
the number of dialog sessions.
D. When you specify the default as the classic Debugger
in the settings of the Object Navigator.
E. If you manually switched to the classic Debugger during
your last session.
4) What does a non-exclusive debugging mode mean?
Select all that apply.
A. A roll-out is forced in the application after each
Debugger view.
B. Someone else is debugging the same source code.
C. Debugging is not possible between the statements SELECT
and ENDSELECT because the database cursor needs to be closed using a COMMIT.
D. Debugging is not possible for conversion or field
exits.
E. Owing to the commit, inconsistent datasets can occur
in the database.
F. It may be used anywhere in the landscape.
5) The Debugger is entirely self-contained and requires no external transactions.
A. True
B. False
---
Answers:
1. (A)
The classic Debugger only allowed a maximum of eight data
objects. The new Debugger allows an unlimited number (restricted only by
font and window size) to be displayed at the same time.
If you encounter a question discussing an ability or
limitation of the classic Debugger, you should assume that the question
refers to the classic Debugger and answer accordingly. If the question
referenced the new Debugger, the answer would be false.
2. (B)
The classic Debugger cannot analyze conversion exits or
field exits. It also has side effects with search help (F1), value help
(F4), and list output.
3) (B, D)
When you already have five external modes in use (or,
more accurately, when you only have one external mode remaining), the classic
Debugger is automatically started when starting another external mode would
prevent further sessions from being created. If you have the default Debugger
specified as the classic, it will always start with this version.
4) (A, C, D, E)
A non-exclusive mode means the session is not locked into
a work process and will be rolled out and rolled in between steps. The
roll-out forces a COMMIT WORK between steps, which means the database cursor
will be lost, causing a short dump if it occurs between a SELECT and ENDSELECT.
Because database commits occur without regard to logical units of work,
the database may
become inconsistent. The Debugger prevents this inconsistency
in a production environment.
5) (B)
While the Debugger is entirely self-contained for use, there are a number of helpful tools that require an additional transaction to allow reusability in your debugging (for example, SAAB used to manage checkpoint groups, SAS used to manage Debugger scripts, and SLAD used to define object sets and profiles).